
Focus Areas & Metrics:
Notes:
The numbers indicated includes organic employees of the group in 2022. In addition, Banking covers UBP and CSB TMs only.
Team Member satisfaction score refers to the %engaged based on the Gallup Engagement Survey. In 2022 the survery covers 3,238 team members (22% of the Total headcount from AEV and AboitizPower)
We use the 4E framework (Education, Experience, Exposure and Environment) in coming up with Learning and Development initiaitves. Aside from attending trainings (Education), individual development can also be in the form of Experience (e.g. on-the-job experience, experimentation, etc.), Exposure (e.g. Coaching and Mentoring, etc.), and Environment (i.e. online learning platforms etc.). We continue to explore other forms of learning to further upskill and reskill our workforce.
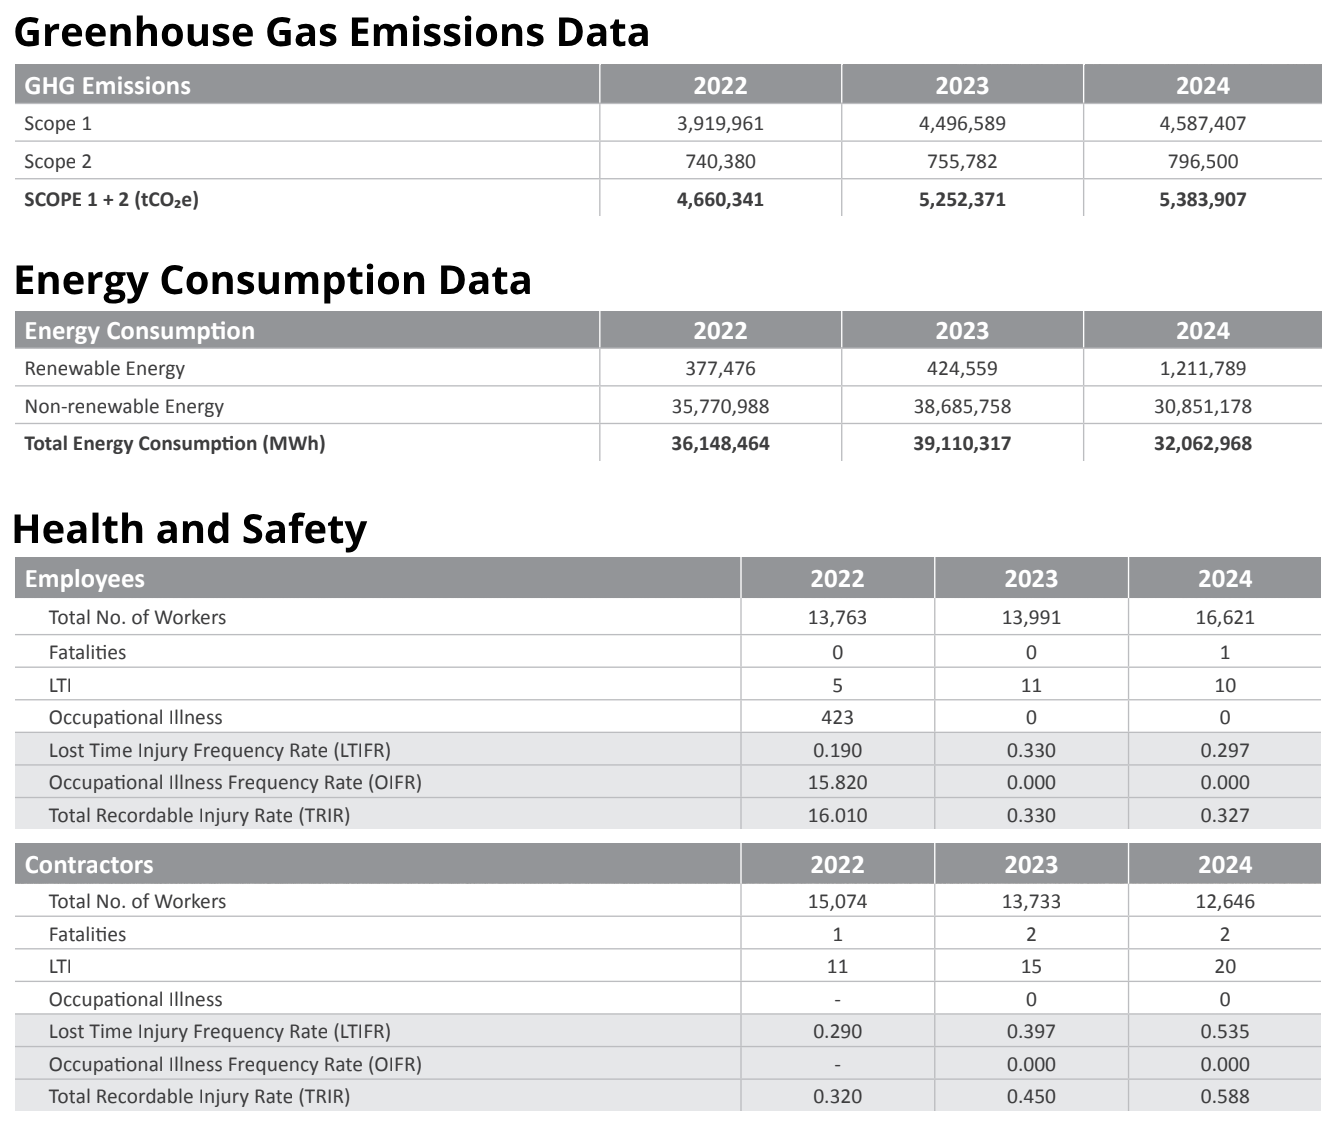
Increase in employee TRIR data for 2022 is due to a high number of recorded Covid-19 incidents.
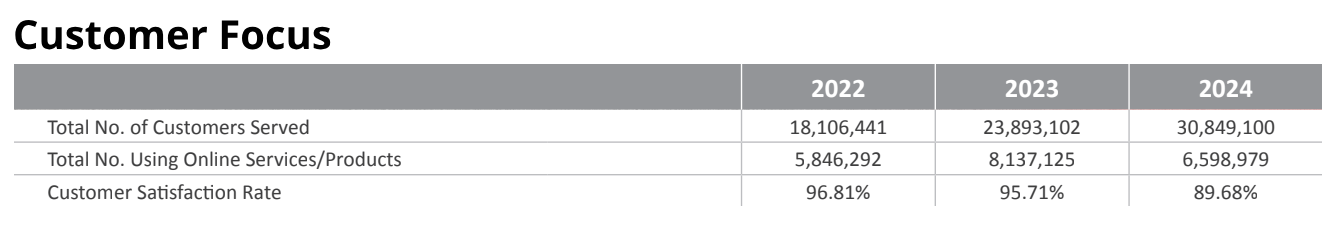
The different SBUs employ their own method of gauging customer satisfaction. For the purpose of consolidation, we are tracking “satisfied” customers as defined by the methodologies employed by the SBUs.
The no. of customers served refers to both B2C and B2B customers.
Notes:
Recalculated figures. See the Restatement table for more information.
Ground water consumption includes data from both renewable and non-renewable sources.
Surface water includes data from both fresh surface water and other water sources. Fresh Surface Water – Water that is naturally occurring water on the Earth’s surface in ice sheets, ice caps, glaciers, icebergs, bogs, ponds, lakes, rivers and streams, and has a low concentration of dissolved solids ((≤1,000 mg/L Total Dissolved Solids) Other Water (>1,000 mg/L Total Dissolved Solids)”.
Third party sources include water provided by municipal water suppliers, public or private utilities, and wastewater from any other organization.
Refers to purchased electricity consumption from the grid and purchased/produced renewable electricity. 2020 data coverage only includes generation facilities for Power and PH operations for our Food subsidiaries.
Waste management data for 2022 is actual recycled and/or reused waste. Data for 2020 and 2021 assume that all generated waste is recyclable but these data pertain to actual generated waste.
Increase in non-RE source is due to operationalization of GNP last January 2022.